Kohl's Corporation
KSS Consumer Cyclical Q4 2025
Document 991
Exhibit 99.1
Kohl’s Reports Fourth Quarter and Full Year Fiscal 2024 Financial Results
MENOMONEE FALLS, Wis.—(BUSINESS WIRE)—March 11, 2025— Kohl’s Corporation (NYSE:KSS) today reported results for the quarter and year ended February 1, 2025.
| • | Fourth quarter net sales decreased 9.4% and comparable sales decreased 6.7%; fiscal year 2024 net sales decreased 7.2% and comparable sales decreased 6.5% |
| • | Fourth quarter diluted earnings per share (“EPS”) of $0.43 and adjusted diluted EPS of $0.95 |
| • | Fiscal year 2024 diluted EPS of $0.98 and adjusted diluted EPS of $1.50 |
| • | Introduces fiscal year 2025 financial outlook |
Ashley Buchanan, Kohl’s Chief Executive Officer, said “Kohl’s is built on a strong foundation that includes operating more than 1,100 conveniently located stores nationwide, serving over 60 million customers, with 30 million of those customers being Kohl’s Loyalty Members. Kohl’s has a tremendous opportunity to build on our strengths, address key areas of opportunity and better serve our customers every day. “
“We have identified key areas of focus and are taking action in 2025 to reposition Kohl’s for future success. Our customers expect great product, great value, and a great experience from Kohl’s. I am confident that the areas we identified will deliver on what customers want and expect from Kohl’s,” Buchanan continued.
Fourth Quarter 2024 Results
Comparisons refer to the 13-week period ended February 1, 2025 versus the 14-week period ended February 3, 2024 unless noted otherwise
| • | Net sales decreased 9.4% year-over-year, to $5.2 billion. The fourth quarter fiscal 2023 included net sales of approximately $164 million from the 14th week. |
| • | Comparable sales, which compare the 13-week period ending February 1, 2025 versus the 13-week period ended January 27, 2024, decreased 6.7%. |
| • | Gross margin as a percentage of net sales was 32.9%, an increase of 49 basis points. |
| • | Selling, general & administrative (SG&A) expenses decreased 4.5% year-over-year, to $1.5 billion. As a percentage of total revenue, SG&A expenses were 28.5%, an increase of 148 basis points year-over-year. |
| • | Operating income was $126 million compared to $299 million in the prior year. As a percentage of total revenue, operating income was 2.3%, a decrease of 270 basis points year-over-year. |
| • | Net income was $48 million, or $0.43 per diluted share, and adjusted net income of $106 million, or $0.95 per adjusted diluted share. This compares to net income of $186 million, or $1.67 per diluted share in the prior year. |
| • | Inventory was $2.9 billion, an increase of 2% year-over-year. |
| • | Operating cash flow was $596 million. |
Fiscal Year 2024 Results
Comparisons refer to the 52-week period ended February 1, 2025 versus the 53-week period ended February 3, 2024 unless noted otherwise
| • | Net sales decreased 7.2% year-over-year, to $15.4 billion. Fiscal 2023 included net sales of approximately $164 million from the 53rd week. |
| • | Comparable sales, which compare the 52-week period ending February 1, 2025 versus the 52-week period ended January 27, 2024, decreased 6.5%. |
| • | Gross margin as a percentage of net sales was 37.2%, an increase of 50 basis points. |
| • | Selling, general & administrative (SG&A) expenses decreased 3.7% year-over-year, to $5.3 billion. As a percentage of total revenue, SG&A expenses were 32.7%, an increase of 118 basis points year-over-year. |
| • | Operating income was $433 million compared to $717 million in the prior year. As a percentage of total revenue, operating income was 2.7%, a decrease of 143 basis points year-over-year. |
| • | Net income was $109 million, or $0.98 per diluted share, and adjusted net income of $167 million, or $1.50 per adjusted diluted share. This compares to net income of $317 million, or $2.85 per diluted share in the prior year. |
| • | Operating cashflow was $648 million. |
| • | Long-term debt was reduced by $113 million through the redemption of the remaining 9.50% notes due May 15, 2025. |
2025 Financial and Capital Allocation Outlook
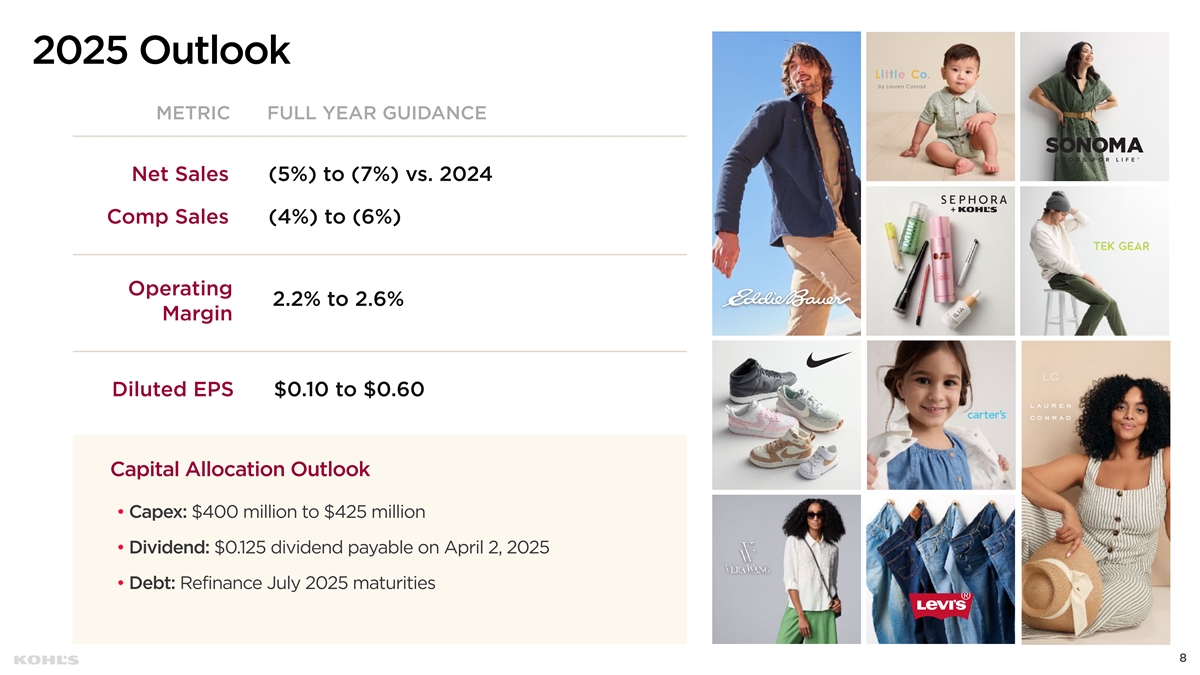
For the full year 2025, the Company currently expects the following:
| • | Net sales: A decrease of (5%) to a decrease of (7%) |
| • | Comparable sales: A decrease of (4%) to a decrease of (6%) |
| • | Operating margin: In the range of 2.2% to 2.6% |
| • | Diluted EPS: In the range of $0.10 to $0.60 |
| • | Capital Expenditures: in the range of $400 million to $425 million |
| • | Dividend: On March 11, 2025, Kohl’s Board of Directors declared a quarterly cash dividend on the Company’s common stock of $0.125 per share. The dividend is payable April 2, 2025 to shareholders of record at the close of business on March 21, 2025. |
Fourth Quarter 2024 Earnings Conference Call
Kohl’s will host its quarterly earnings conference call at 9:00 am ET on March 11, 2025. A webcast of the conference call and the related presentation materials will be available via the Company’s web site at investors.kohls.com, both live and after the call.
Cautionary Statement Regarding Forward-Looking Information and Non-GAAP Measures
This press release contains “forward-looking statements” within the meaning of the Private Securities Litigation Reform Act of 1995. The Company intends forward-looking terminology such as “believes,” “expects,” “may,” “will,” “should,” “anticipates,” “plans,” or similar expressions to identify forward-looking statements. Forward-looking statements include the information under “2025 Financial and Capital Allocation Outlook.” Such statements are subject to certain risks and uncertainties, which could cause the Company’s actual results to differ materially from those anticipated by the forward-looking statements. These risks and uncertainties include, but are not limited to, risks described more fully in Item 1A in the Company’s Annual Report on Form 10-K, which are expressly incorporated herein by reference, and other factors as may periodically be described in the Company’s filings with the SEC. Forward-looking statements relate to the date initially made, and the Company undertakes no obligation to update them.
This press release contains certain financial measures that are not prepared in accordance with generally accepted accounting principles (GAAP), including adjusted net income and adjusted diluted earnings per share. These non-GAAP financial measures are provided as additional insight into our operational performance and do not purport to be substitutes for, or superior to, net income or diluted earnings per share as a measure of operating performance. We believe these adjusted measures are useful, as they are more representative of our core business, enhance comparability across reporting periods and to industry peers, and align with the measures used by management to evaluate the Company’s performance. We caution investors that non-GAAP measures should not be viewed in isolation and should be evaluated in addition to, and not as an alternative for, our results reported in accordance with GAAP. Because companies may use different calculation methods, these measures may not be comparable to other similarly titled measures reported by other companies. A reconciliation of each non-GAAP measure to the most directly comparable GAAP measure is included in this release.
About Kohl’s
Kohl’s (NYSE: KSS) is a leading omnichannel retailer built on a foundation that combines great brands, incredible value and convenience for our customers. Kohl’s is uniquely positioned to deliver against its long-term strategy and its purpose to take care of families’ realest moments. Kohl’s serves millions of families in its more than 1,100 stores in 49 states, online at Kohls.com, and through the Kohl’s App. With a large national footprint, Kohl’s is committed to making a positive impact in the communities it serves. For a list of store locations or to shop online, visit Kohls.com. For more information about Kohl’s impact in the community or how to join our winning team, visit Corporate.Kohls.com.
Contacts
Investor Relations:
Jill Timm, (262) 703-2203,jill.timm@kohls.com
Media:
Jen Johnson, (262) 703-5241,jen.johnson@kohls.com
KOHL’S CORPORATION
CONSOLIDATED STATEMENTS OF OPERATIONS
(Unaudited)
| Three Months Ended | Twelve Months Ended | |||||||||||||||
(Dollars in Millions, Except per Share Data) | February 1, 2025 | February 3, 2024 | February 1, 2025 | February 3, 2024 | ||||||||||||
Net sales | $ | 5,175 | $ | 5,710 | $ | 15,385 | $ | 16,586 | ||||||||
Other revenue | 222 | 246 | 836 | 890 | ||||||||||||
|
|
|
|
|
|
|
| |||||||||
Total revenue | 5,397 | 5,956 | 16,221 | 17,476 | ||||||||||||
Cost of merchandise sold | 3,473 | 3,860 | 9,661 | 10,498 | ||||||||||||
Gross margin rate | 32.9 | % | 32.4 | % | 37.2 | % | 36.7 | % | ||||||||
Operating expenses: | ||||||||||||||||
Selling, general, and administrative | 1,539 | 1,610 | 5,308 | 5,512 | ||||||||||||
As a percent of total revenue | 28.5 | % | 27.0 | % | 32.7 | % | 31.5 | % | ||||||||
Depreciation and amortization | 183 | 187 | 743 | 749 | ||||||||||||
Impairments, store closing, and other costs | 76 | — | 76 | — | ||||||||||||
|
|
|
|
|
|
|
| |||||||||
Operating income | 126 | 299 | 433 | 717 | ||||||||||||
Interest expense, net | 74 | 82 | 319 | 344 | ||||||||||||
|
|
|
|
|
|
|
| |||||||||
Income before income taxes | 52 | 217 | 114 | 373 | ||||||||||||
Provision for income taxes | 4 | 31 | 5 | 56 | ||||||||||||
|
|
|
|
|
|
|
| |||||||||
Net income | $ | 48 | $ | 186 | $ | 109 | $ | 317 | ||||||||
|
|
|
|
|
|
|
| |||||||||
Average number of shares: |
|
|
|
|
|
|
|
|
|
|
|
| ||||
Basic | 111 | 110 | 111 | 110 | ||||||||||||
Diluted | 112 | 111 | 112 | 111 | ||||||||||||
Earnings per share: |
|
|
|
|
|
|
|
|
|
|
|
| ||||
Basic | $ | 0.43 | $ | 1.69 | $ | 0.98 | $ | 2.88 | ||||||||
Diluted | $ | 0.43 | $ | 1.67 | $ | 0.98 | $ | 2.85 | ||||||||
ADJUSTED NET INCOME AND DILUTED EARNINGS PER SHARE, NON-GAAP FINANCIAL MEASURES
(Unaudited)
| Three Months Ended | Twelve Months Ended | |||||||||||||||
(Dollars in Millions, Except per Share Data) | February 1, 2025 | February 3, 2024 | February 1, 2025 | February 3, 2024 | ||||||||||||
Net income (GAAP) | $ | 48 | $ | 186 | $ | 109 | $ | 317 | ||||||||
Impairments, store closing, and other costs | 76 | — | 76 | — | ||||||||||||
Income tax impact of items noted above | (18 | ) | — | (18 | ) | — | ||||||||||
|
|
|
|
|
|
|
| |||||||||
Adjusted Net income (non-GAAP) | $ | 106 | $ | 186 | $ | 167 | $ | 317 | ||||||||
|
|
|
|
|
|
|
| |||||||||
Diluted earnings per share (GAAP) | $ | 0.43 | $ | 1.67 | $ | 0.98 | $ | 2.85 | ||||||||
Impairments, store closing, and other costs | 0.69 | — | 0.69 | — | ||||||||||||
Income tax impact of items noted above | (0.17 | ) | — | (0.17 | ) | — | ||||||||||
|
|
|
|
|
|
|
| |||||||||
Adjusted Diluted earnings per share (non-GAAP) | $ | 0.95 | $ | 1.67 | $ | 1.50 | $ | 2.85 | ||||||||
|
|
|
|
|
|
|
| |||||||||
KOHL’S CORPORATION
CONSOLIDATED BALANCE SHEETS
(Unaudited)
(Dollars in Millions) | February 1, 2025 | February 3, 2024 | ||||||
Assets |
|
|
|
|
|
| ||
Current assets: | ||||||||
Cash and cash equivalents | $ | 134 | $ | 183 | ||||
Merchandise inventories | 2,945 | 2,880 | ||||||
Other | 309 | 347 | ||||||
|
|
|
| |||||
Total current assets | 3,388 | 3,410 | ||||||
Property and equipment, net | 7,297 | 7,720 | ||||||
Operating leases | 2,394 | 2,499 | ||||||
Other assets | 480 | 380 | ||||||
|
|
|
| |||||
Total assets | $ | 13,559 | $ | 14,009 | ||||
|
|
|
| |||||
Liabilities and Shareholders’ Equity |
|
|
|
|
|
| ||
Current liabilities: | ||||||||
Accounts payable | $ | 1,042 | $ | 1,134 | ||||
Accrued liabilities | 1,263 | 1,201 | ||||||
Borrowings under revolving credit facility | 290 | 92 | ||||||
Current portion of: | ||||||||
Long-term debt | 353 | — | ||||||
Finance leases and financing obligations | 81 | 83 | ||||||
Operating leases | 102 | 102 | ||||||
|
|
|
| |||||
Total current liabilities | 3,131 | 2,612 | ||||||
Long-term debt | 1,174 | 1,638 | ||||||
Finance leases and financing obligations | 2,456 | 2,680 | ||||||
Operating leases | 2,703 | 2,781 | ||||||
Deferred income taxes | 28 | 107 | ||||||
Other long-term liabilities | 265 | 298 | ||||||
Shareholders’ equity: | 3,802 | 3,893 | ||||||
|
|
|
| |||||
Total liabilities and shareholders’ equity | $ | 13,559 | $ | 14,009 | ||||
|
|
|
| |||||
KOHL’S CORPORATION
CONSOLIDATED STATEMENTS OF CASH FLOWS
(Unaudited)
| Twelve Months Ended | ||||||||
(Dollars in Millions) | February 1, 2025 | February 3, 2024 | ||||||
Operating activities |
|
|
|
|
|
| ||
Net income | $ | 109 | $ | 317 | ||||
Adjustments to reconcile net income to net cash provided by operating activities: | ||||||||
Depreciation and amortization | 743 | 749 | ||||||
Share-based compensation | 30 | 42 | ||||||
Deferred income taxes | (85 | ) | (8 | ) | ||||
Impairments, store closing, and other costs | 36 | — | ||||||
Non-cash lease expense | 89 | 92 | ||||||
Other non-cash items | 1 | 6 | ||||||
Changes in operating assets and liabilities: | ||||||||
Merchandise inventories | (60 | ) | 315 | |||||
Other current and long-term assets | (50 | ) | 11 | |||||
Accounts payable | (92 | ) | (196 | ) | ||||
Accrued and other long-term liabilities | 20 | (67 | ) | |||||
Operating lease liabilities | (93 | ) | (93 | ) | ||||
|
|
|
| |||||
Net cash provided by operating activities | 648 | 1,168 | ||||||
|
|
|
| |||||
Investing activities |
|
|
|
|
|
| ||
Acquisition of property and equipment | (466 | ) | (577 | ) | ||||
Proceeds from sale of real estate | 6 | 26 | ||||||
Other | (7 | ) | (11 | ) | ||||
|
|
|
| |||||
Net cash used in investing activities | (467 | ) | (562 | ) | ||||
|
|
|
| |||||
Financing activities |
|
|
|
|
|
| ||
Net borrowings under revolving credit facility | 198 | 7 | ||||||
Shares withheld for taxes on vested restricted shares | (10 | ) | (16 | ) | ||||
Dividends paid | (222 | ) | (220 | ) | ||||
Repayment of long-term borrowings | (113 | ) | (275 | ) | ||||
Premium paid on redemption of debt | (5 | ) | — | |||||
Finance lease and financing obligation payments | (79 | ) | (93 | ) | ||||
Proceeds from financing obligations | 1 | 21 | ||||||
|
|
|
| |||||
Net cash used in financing activities | (230 | ) | (576 | ) | ||||
|
|
|
| |||||
Net (decrease) increase in cash and cash equivalents | (49 | ) | 30 | |||||
Cash and cash equivalents at beginning of period | 183 | 153 | ||||||
|
|
|
| |||||
Cash and cash equivalents at end of period | $ | 134 | $ | 183 | ||||
|
|
|
| |||||
Document 992

Exhibit 99.2 Q4 Results Presentation . . . . . . . . . . . . . . . . . . . . . . . . March 11, 2025 . . . . . . . . . . . . . . . . . . . . . . . . . . . . . . 1
Cautionary Statement Regarding Forward-Looking Information This presentation contains “forward-looking statements” within the meaning of the Private Securities Litigation Reform Act of 1995. The Company intends forward-looking terminology such as “believes,” “expects,” “may,” “will,” “should,” “anticipates,” “plans,” or similar expressions to identify forward-looking statements. Forward-looking statements include, but are not limited to, the information under 2025 Outlook , comments about Kohl’s adequacy of capital resources and the competitive environment. Such statements are subject to certain risks and uncertainties, which could cause the Company's actual results to differ materially from those anticipated by the forward-looking statements. These risks and uncertainties include, but are not limited to, risks described more fully in Item 1A in the Company’s Annual Report on Form 10-K, which are expressly incorporated herein by reference, and other factors as may periodically be described in the Company’s filings with the SEC. Any number of risks and uncertainties could cause actual results to differ materially from those Kohl’s expresses in its forward-looking statements, including macroeconomic conditions such as inflation. Forward-looking statements relate to the date initially made, and Kohl’s undertakes no obligation to update them. Non-GAAP Financial Measures This presentation contains certain financial measures that are not prepared in accordance with generally accepted accounting principles (GAAP), including adjusted net income, adjusted diluted earnings per share, and adjusted free cash flow. These non-GAAP financial measures are provided as additional insight into our operational performance and do not purport to be substitutes for, or superior to, net income, diluted earnings per share, or operating cash flow as a measure of operating performance. We believe these adjusted measures are useful, as they are more representative of our core business, enhance comparability across reporting periods and to industry peers, and align with the measures used by management to evaluate the Company’s performance. We caution investors that non-GAAP measures should not be viewed in isolation and should be evaluated in addition to, and not as an alternative for, our results reported in accordance with GAAP. Because companies may use different calculation methods, these measures may not be comparable to other similarly titled measures reported by other companies. A reconciliation of each non-GAAP measure to the most directly comparable GAAP measure is included in the appendix of this presentation. 2

Table of Contents 2025 Outlook 6 Q4 2024 Results 10 3
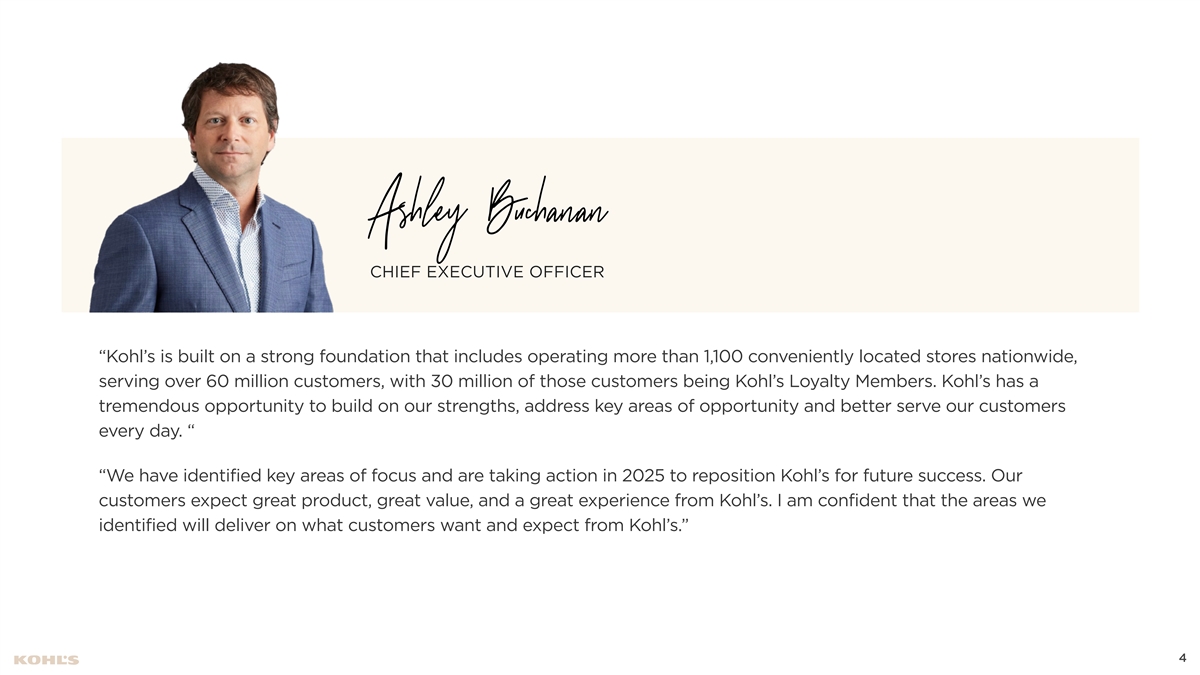
Ashley Buchanan CHIEF EXECUTIVE OFFICER “Kohl’s is built on a strong foundation that includes operating more than 1,100 conveniently located stores nationwide, serving over 60 million customers, with 30 million of those customers being Kohl’s Loyalty Members. Kohl’s has a tremendous opportunity to build on our strengths, address key areas of opportunity and better serve our customers every day. “ “We have identified key areas of focus and are taking action in 2025 to reposition Kohl’s for future success. Our customers expect great product, great value, and a great experience from Kohl’s. I am confident that the areas we identified will deliver on what customers want and expect from Kohl’s.” 4
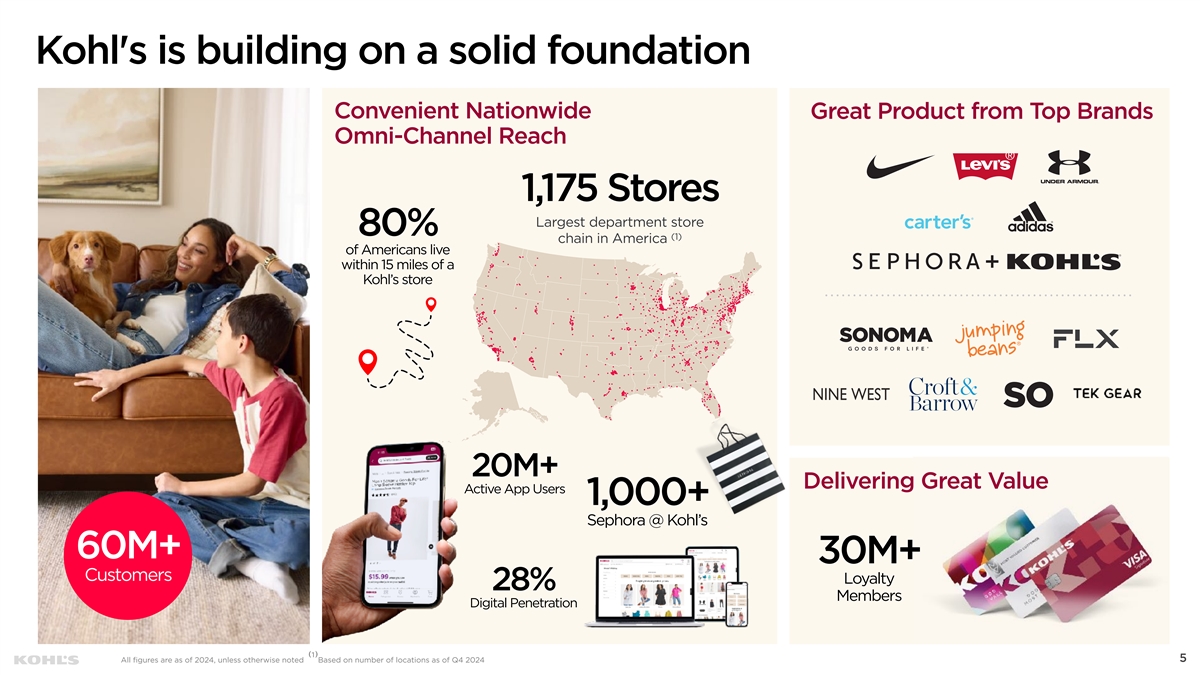
Kohl's is building on a solid foundation Convenient Nationwide Great Product from Top Brands Omni-Channel Reach 1,175 Stores Largest department store 80% (1) chain in America of Americans live within 15 miles of a Kohl’s store 20M+ Delivering Great Value Active App Users 1,000+ Sephora @ Kohl’s 60M+ 30M+ Customers Loyalty 28% Members Digital Penetration 5 All figures are as of 2024, unless otherwise noted ⁽¹⁾Based on number of locations as of Q4 2024

2025 OUTLOOK . . . . . . Connor 4Real . . . . . . . . . . . . . . . . . . . . . . . . . . . . . . . . . . . . . . . . . . 6
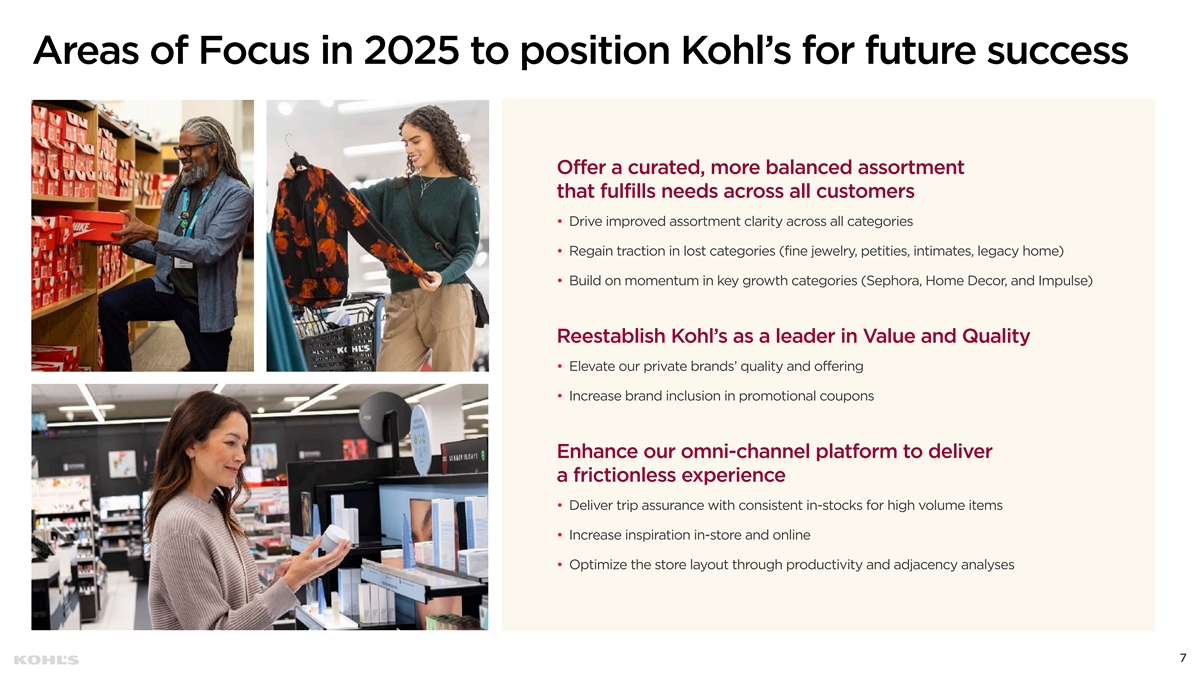
Areas of Focus in 2025 to position Kohl’s for future success Offer a curated, more balanced assortment that fulfills needs across all customers • Drive improved assortment clarity across all categories • Regain traction in lost categories (fine jewelry, petities, intimates, legacy home) • Build on momentum in key growth categories (Sephora, Home Decor, and Impulse) Reestablish Kohl’s as a leader in Value and Quality • Elevate our private brands’ quality and offering • Increase brand inclusion in promotional coupons Enhance our omni-channel platform to deliver a frictionless experience • Deliver trip assurance with consistent in-stocks for high volume items • Increase inspiration in-store and online • Optimize the store layout through productivity and adjacency analyses 7
2025 Outlook METRIC FULL YEAR GUIDANCE Net Sales (5%) to (7%) vs. 2024 Comp Sales (4%) to (6%) Operating 2.2% to 2.6% Margin Diluted EPS $0.10 to $0.60 Capital Allocation Outlook • Capex: $400 million to $425 million • Dividend: $0.125 dividend payable on April 2, 2025 • Debt: Refinance July 2025 maturities 8
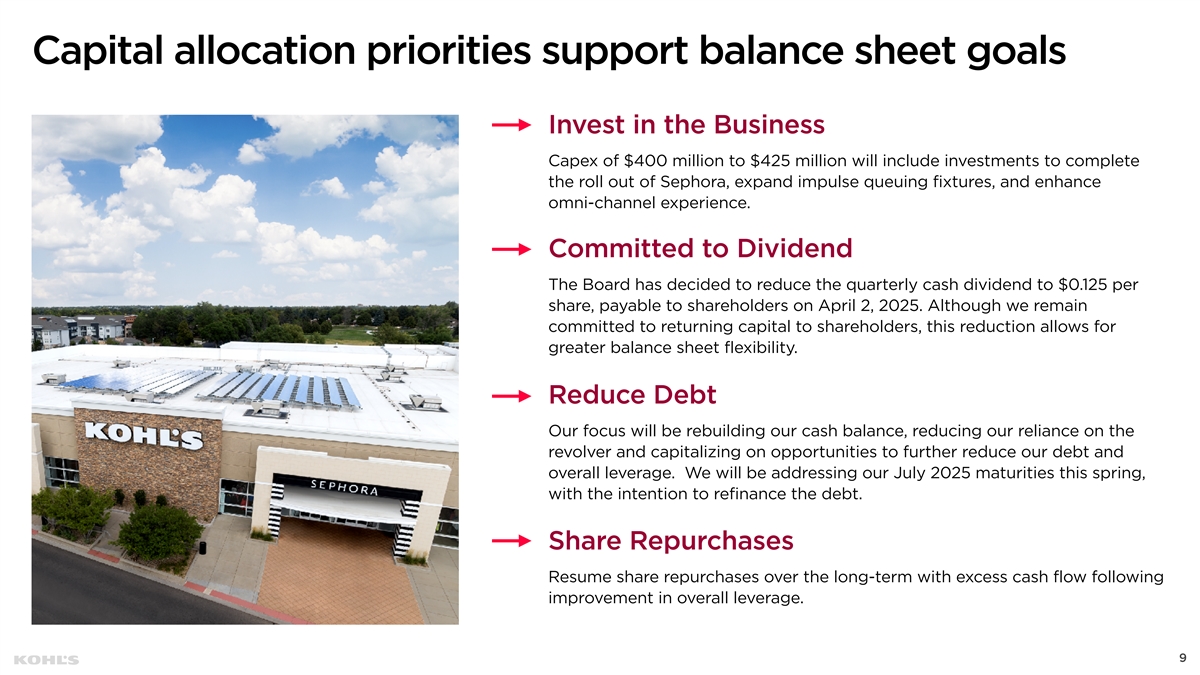
Capital allocation priorities support balance sheet goals Invest in the Business Capex of $400 million to $425 million will include investments to complete the roll out of Sephora, expand impulse queuing fixtures, and enhance omni-channel experience. Committed to Dividend The Board has decided to reduce the quarterly cash dividend to $0.125 per share, payable to shareholders on April 2, 2025. Although we remain committed to returning capital to shareholders, this reduction allows for greater balance sheet flexibility. Reduce Debt Our focus will be rebuilding our cash balance, reducing our reliance on the revolver and capitalizing on opportunities to further reduce our debt and overall leverage. We will be addressing our July 2025 maturities this spring, with the intention to refinance the debt. Share Repurchases Resume share repurchases over the long-term with excess cash flow following improvement in overall leverage. 9

Q4 2024 RESULTS . . . . . . Connor 4Real . . . . . . . . . . . . . . . . . . . . . . . . . . . . . . . . . . . . . . . . . . 10
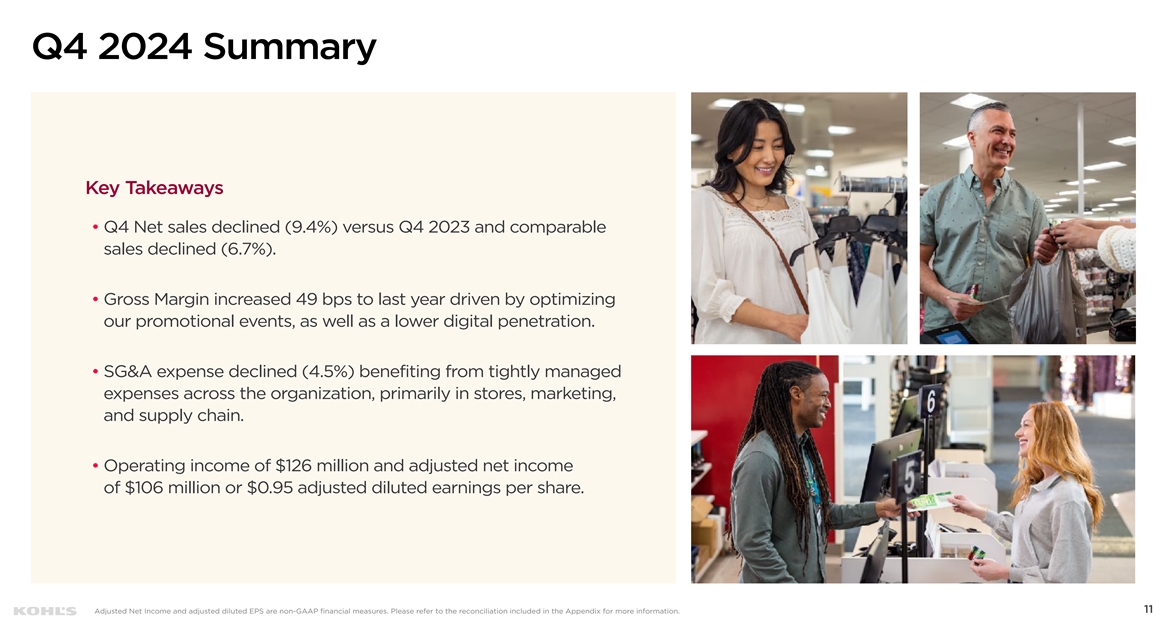
Q4 2024 Summary Key Takeaways • Q4 Net sales declined (9.4%) versus Q4 2023 and comparable sales declined (6.7%). • Gross Margin increased 49 bps to last year driven by optimizing our promotional events, as well as a lower digital penetration. • SG&A expense declined (4.5%) benefiting from tightly managed expenses across the organization, primarily in stores, marketing, and supply chain. • Operating income of $126 million and adjusted net income of $106 million or $0.95 adjusted diluted earnings per share. 11 11 Adjusted Net Income and adjusted diluted EPS are non-GAAP financial measures. Please refer to the reconciliation included in the Appendix for more information.
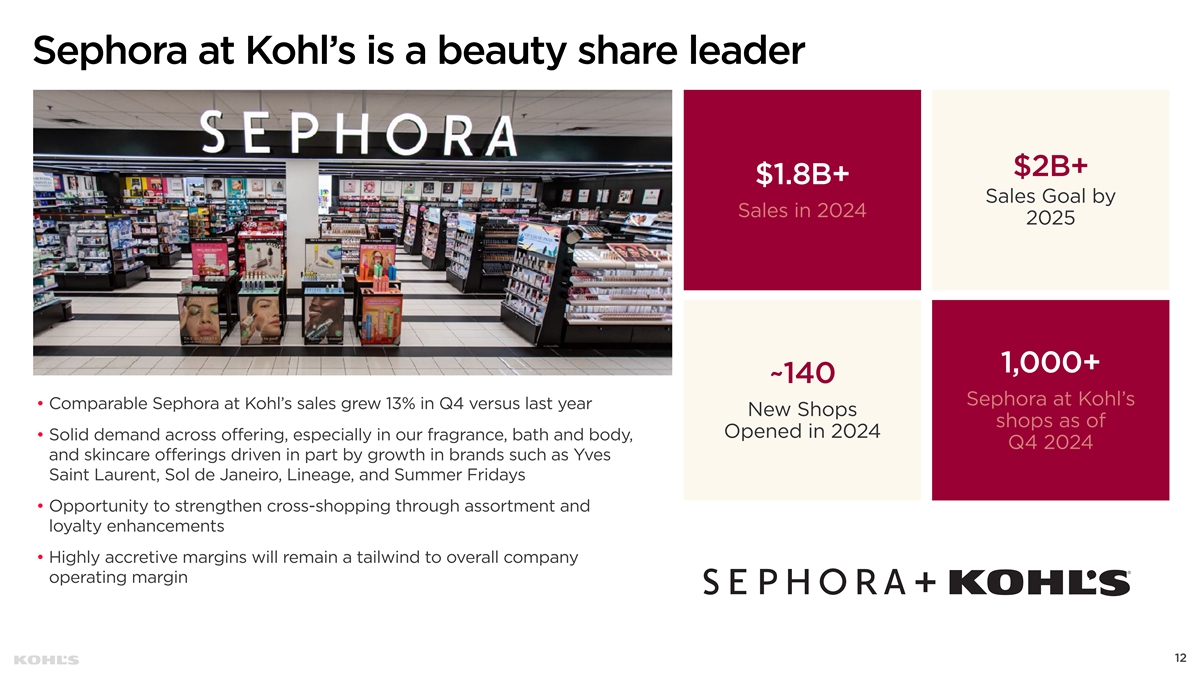
Sephora at Kohl’s is a beauty share leader $2B+ $1.8B+ Sales Goal by Sales in 2024 2025 1,000+ ~140 Sephora at Kohl’s • Comparable Sephora at Kohl’s sales grew 13% in Q4 versus last year New Shops shops as of Opened in 2024 • Solid demand across offering, especially in our fragrance, bath and body, Q4 2024 and skincare offerings driven in part by growth in brands such as Yves Saint Laurent, Sol de Janeiro, Lineage, and Summer Fridays • Opportunity to strengthen cross-shopping through assortment and loyalty enhancements • Highly accretive margins will remain a tailwind to overall company operating margin 12
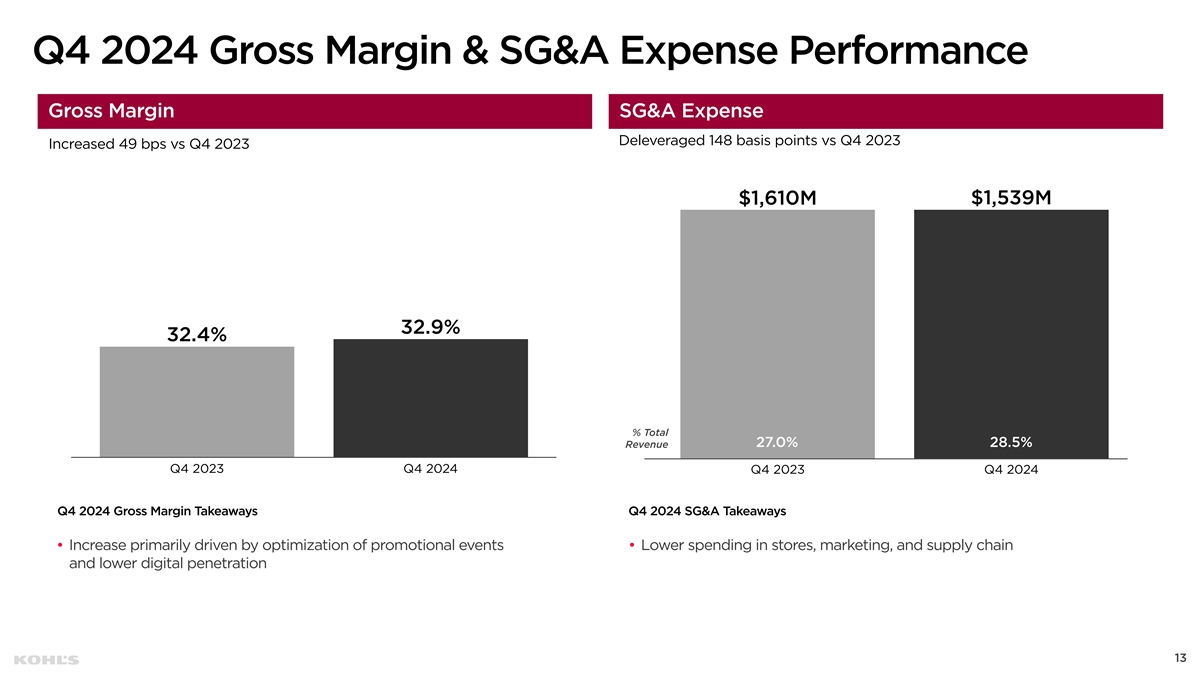
Q4 2024 Gross Margin & SG&A Expense Performance Gross Margin SG&A Expense Deleveraged 148 basis points vs Q4 2023 Increased 49 bps vs Q4 2023 $1,610M $1,539M 32.9% 32.4% % Total 27.0% 28.5% Revenue Q4 2023 Q4 2024 Q4 2023 Q4 2024 Q4 2024 Gross Margin Takeaways Q4 2024 SG&A Takeaways • Increase primarily driven by optimization of promotional events • Lower spending in stores, marketing, and supply chain and lower digital penetration 13
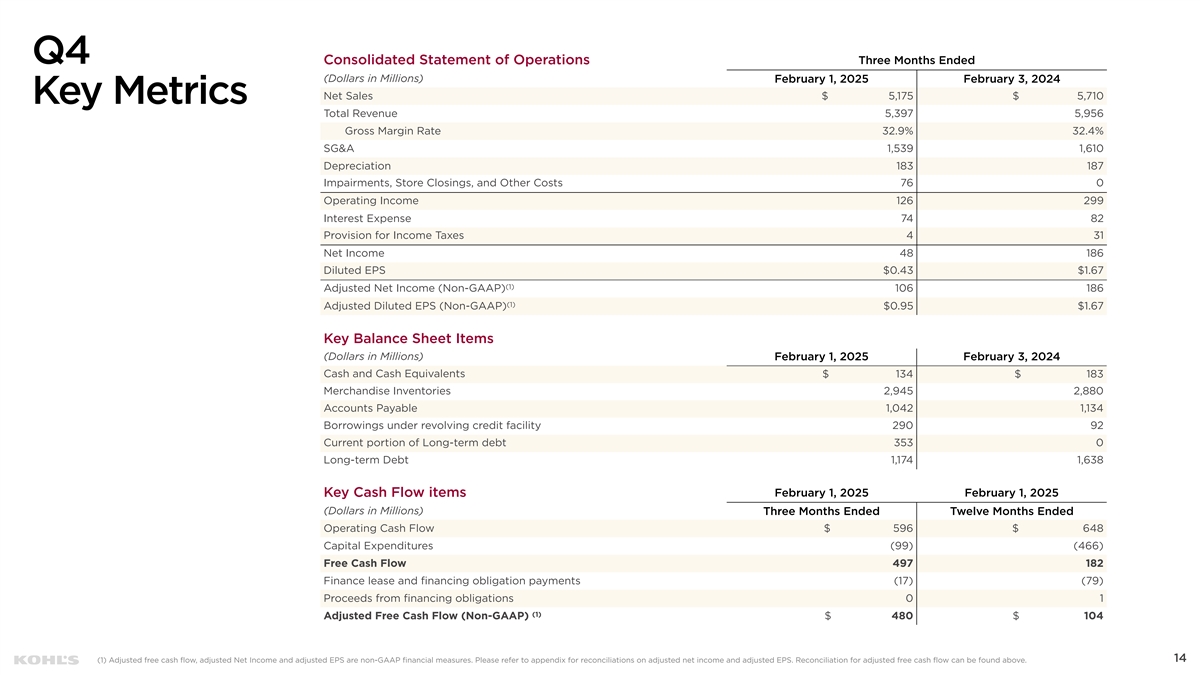
Q4 Three Months Ended Consolidated Statement of Operations (Dollars in Millions) February 1, 2025 February 3, 2024 Net Sales $ 5,175 $ 5,710 Key Metrics Total Revenue 5,397 5,956 Gross Margin Rate 32.9% 32.4% SG&A 1,539 1,610 Depreciation 183 187 Impairments, Store Closings, and Other Costs 76 0 Operating Income 126 299 Interest Expense 74 82 Provision for Income Taxes 4 31 Net Income 48 186 Diluted EPS $0.43 $1.67 (1) Adjusted Net Income (Non-GAAP) 106 186 (1) Adjusted Diluted EPS (Non-GAAP) $0.95 $1.67 Key Balance Sheet Items (Dollars in Millions) February 1, 2025 February 3, 2024 Cash and Cash Equivalents $ 134 $ 183 Merchandise Inventories 2,945 2,880 Accounts Payable 1,042 1,134 Borrowings under revolving credit facility 290 92 Current portion of Long-term debt 353 0 Long-term Debt 1,174 1,638 February 1, 2025 February 1, 2025 Key Cash Flow items (Dollars in Millions) Three Months Ended Twelve Months Ended Operating Cash Flow $ 596 $ 648 Capital Expenditures (99) (466) Free Cash Flow 497 182 Finance lease and financing obligation payments (17) (79) Proceeds from financing obligations 0 1 (1) Adjusted Free Cash Flow (Non-GAAP) $ 480 $ 104 14 (1) Adjusted free cash flow, adjusted Net Income and adjusted EPS are non-GAAP financial measures. Please refer to appendix for reconciliations on adjusted net income and adjusted EPS. Reconciliation for adjusted free cash flow can be found above.

APPENDIX . . . . . . Connor 4Real . . . . . . . . . . . . . . . . . . . . . . . . . . . . . . . . . . . . . . . . . . 15
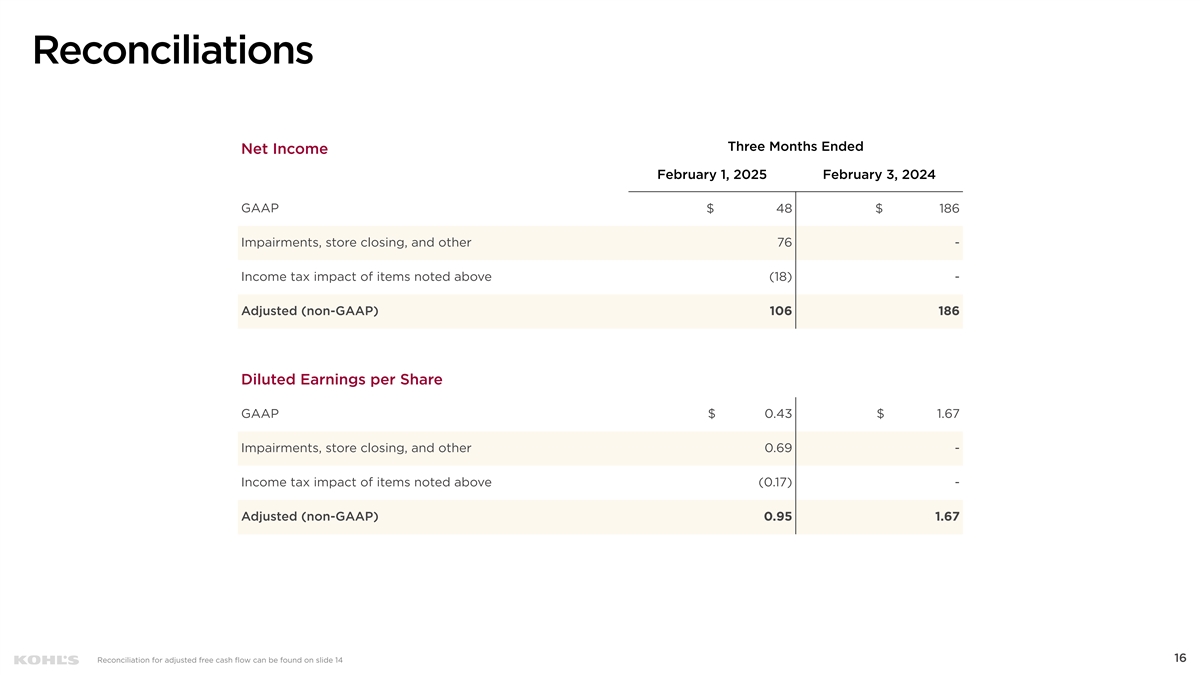
Reconciliations Three Months Ended Net Income February 1, 2025 February 3, 2024 GAAP $ 48 $ 186 Impairments, store closing, and other 76 - Income tax impact of items noted above (18) - Adjusted (non-GAAP) 106 186 Diluted Earnings per Share GAAP $ 0.43 $ 1.67 Impairments, store closing, and other 0.69 - Income tax impact of items noted above (0.17) - Adjusted (non-GAAP) 0.95 1.67 16 Reconciliation for adjusted free cash flow can be found on slide 14
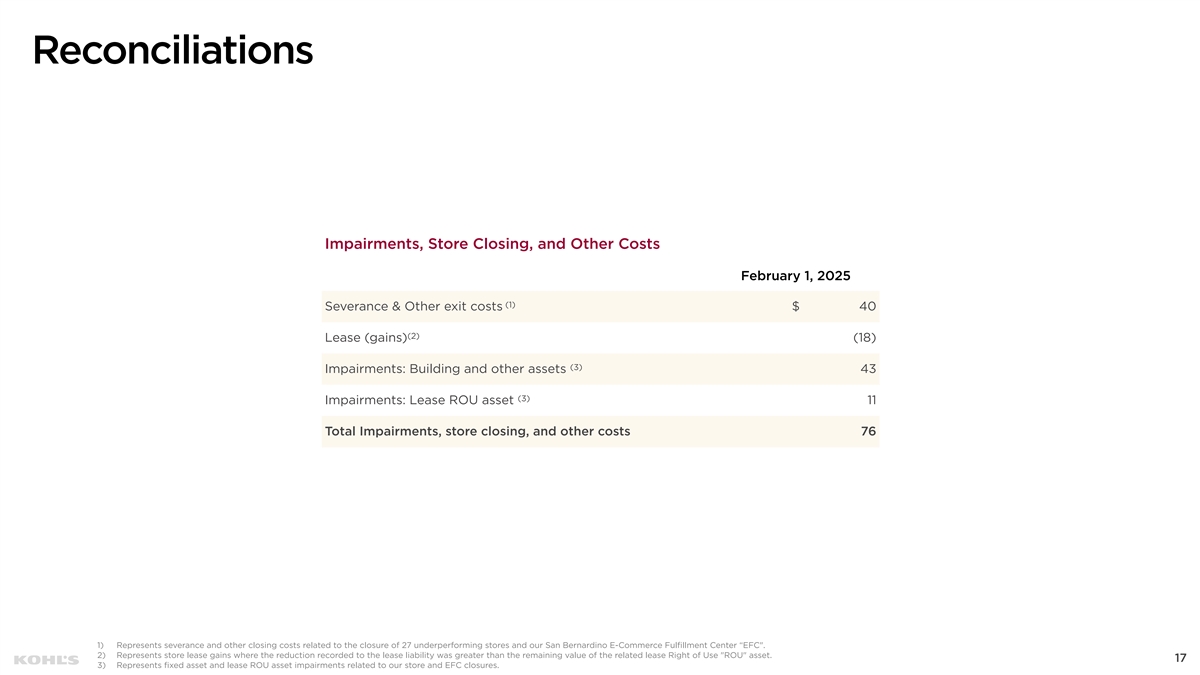
Reconciliations Impairments, Store Closing, and Other Costs February 1, 2025 (1) Severance & Other exit costs $ 40 (2) Lease (gains) (18) (3) Impairments: Building and other assets 43 (3) Impairments: Lease ROU asset 11 Total Impairments, store closing, and other costs 76 1) Represents severance and other closing costs related to the closure of 27 underperforming stores and our San Bernardino E-Commerce Fulfillment Center “EFC . 2) Represents store lease gains where the reduction recorded to the lease liability was greater than the remaining value of the related lease Right of Use ROU asset. 17 3) Represents fixed asset and lease ROU asset impairments related to our store and EFC closures.